
📊 Full opportunity report: The Bubble Question, Disentangled: 1999 vs 2026 Category by Category on ThorstenMeyerAI.com — validation score, market gap, and execution plan.
TL;DR
This article analyzes the similarities and differences between the 1999 dotcom bubble and the current AI cycle in 2026. It categorizes investments to determine which are bubble-driven and which demonstrate genuine value, helping investors and policymakers understand the evolving landscape.
In May 2026, the debate over whether the current AI cycle constitutes a bubble has intensified, with experts analyzing specific investment categories to determine which are driven by bubble dynamics and which reflect real, durable value.
Thorsten Meyer reports that the comparison between the 1999 dotcom bubble and the 2026 AI cycle reveals a complex picture. While some indicators, such as extreme private valuations and concentrated VC investments, resemble bubble characteristics, other metrics like earnings growth and real revenue demonstrate more grounded fundamentals in 2026.
Key data points include the massive AI infrastructure investments totaling $725 billion in 2026, which surpass the telecom capex of the dotcom era, and the high concentration of VC funding in a few dominant AI firms like OpenAI and Anthropic. Experts like Sam Altman and Jamie Dimon have warned of potential bubble risks, but others point to tangible productivity gains and revenue growth supporting the cycle’s durability.
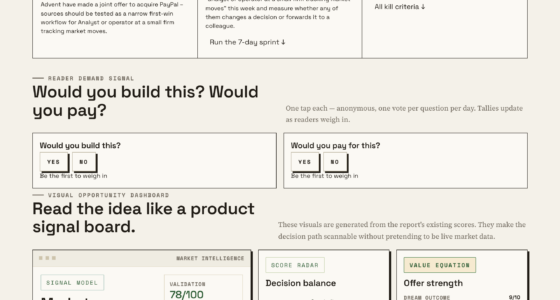
Not binary.
Category by category.
Some bets show clear bubble dynamics. Some show durable value. The disentanglement matters more than the aggregate framing.
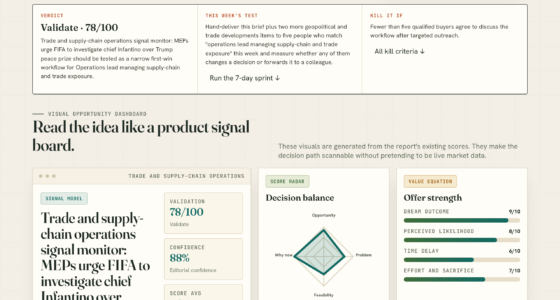
OpenAI $730B private valuation. Anthropic $380B. Mag 7 forward P/E 38× vs Dot-com peak 30×. BUT: earnings-driven returns (78%) vs Dot-com multiple-driven (314%). Real productivity gains. Mag 7 outsized free cash flow. Carlota Perez framing applies.
Two cycles. Twelve dimensions.
On price-and-fundamentals dimensions, 2024-2026 is more grounded than 1999. On capital-allocation dimensions, 2024-2026 has bubble-comparable or worse characteristics. The dual signal explains the analyst disagreement.

Buy, Rehab, Rent, Refinance, Repeat: The BRRRR Rental Property Investment Strategy Made Simple
As an affiliate, we earn on qualifying purchases.
As an affiliate, we earn on qualifying purchases.
Five frothy. Five durable. Three contested.
The honest read: the cycle is structurally bifurcated. Some categories are not in bubble territory; others are. The contested middle is where the bubble question actually resolves through 2027-2028.
- Mega-deal concentrationOpenAI $730B, Anthropic $380B, Databricks $134B.
- Circular financingMSFT→OpenAI→CoreWeave→NVDA→MSFT loop.
- Capex velocity$725B exceeds revenue translation. $1.5T debt by 2028.
- Cahn / Sequoia argument$5T buildout requires AGI by 2030.
- Capital-flow speed$700B retail equity since Jan · 5× faster than 2000.
- Hyperscaler capex justificationCahn (only AGI) vs Goldman (justified by trajectory).
- NVIDIA addressable shareCUDA moat vs in-house silicon migration to 30-45% by 2028.
- Frontier-lab valuationsPlatform companies vs commodity API providers.
- Earnings-driven returns78% earnings · 9% multiples vs Dot-com 314% multiples.
- Mag 7 FCF + buybacksMicrosoft $90B FCF · Alphabet $70B · structural cushion.
- Profit weight matchesTech ~30% market cap, ~20% profits vs 1999 35%/10% gap.
- Forward margins recordS&P Tech margin estimates at all-time highs.
- Real productivity30-50% call center · 20-40% software eng · measurable today.

AI Startup Strategy: A Blueprint to Building Successful Artificial Intelligence Products from Inception to Exit
As an affiliate, we earn on qualifying purchases.
As an affiliate, we earn on qualifying purchases.
Three paths. One question.
35/50/15 probability. Base scenario most likely because durable-value supports prevent worst-case but bubble signals are too strong to resolve without correction.
- Frothy correct 30-50%Frontier labs, circular financing.
- Mag 7 sustainsReal productivity continues.
- Hyperscaler capex defensibleMixed but justified.
- NVIDIA gradual decelNot sharp.
- Outcome: Uneven returns. Big winners + losers. No broad crash.
- Frontier labs -40-60%From 2026 peaks.
- Hyperscaler impair$50-150B capex aggregate.
- NVIDIA sharp decelFY28 30-50% growth vs FY26 75%.
- NASDAQ -30-50%12-24 month period.
- Outcome: Mag 7 cushion holds. Deployment continues delayed.
- NASDAQ -60-78%Matching 2001-2003 magnitude.
- Frontier labs collapseBelow VC entry pricing.
- Hyperscaler impair $300-500BMajor capex writedowns.
- NVIDIA negative quartersRevenue compression.
- Outcome: Multi-year recovery. Deployment 2032-2033.
The 2024-2026 cycle is structurally more grounded than 1999 on price-and-fundamentals dimensions and structurally similar or worse on capital-allocation dimensions. The bifurcation explains the analyst disagreement and predicts the correction pattern: specific categories correct sharply while others persist.

The AI Productivity Blueprint: Work Smarter, Earn More, and Reclaim Your Time Using Artificial Intelligence Tools, ChatGPT, and Automation — Even If You're Not Tech-Savvy
As an affiliate, we earn on qualifying purchases.
As an affiliate, we earn on qualifying purchases.
Four assignments. By role.
Stop pricing AI as single asset class.
Differentiate Mag 7 (durable-value-leaning) from pure-play AI infrastructure (bubble-leaning) from contested middle (NVIDIA, frontier labs). Position long durable-value categories; short or underweight bubble-categories with circular-financing exposure. Use Perez framing to size correction expectations.
Pace through 2026-2027.
Preserve dry powder for 2028-2029. Mega-rounds at $300B+ valuations carry asymmetric correction risk. Mid-stage product-market-fit names with real revenue carry durable value through any plausible correction. The 1999 lesson: winners eventually recover; losers don’t.
Build for survivable correction.
18-24 month cash runway assumptions that survive 30-50% valuation correction. Prioritize real revenue over narrative-driven funding. Structure cap tables to absorb down-round scenarios. Peak-fundraising window of 2025-2026 may not persist; raise opportunistically while it does.
Multi-vendor sourcing for price volatility.
Plan for AI service price volatility through 2027-2028. Prices may rise (power constraint) or fall (frontier-lab competitive pressure). Multi-vendor sourcing reduces single-vendor exposure. Contractual flexibility (escalators, exit provisions, renegotiation triggers) preserves optionality.
Empire of AI: Dreams and Nightmares in Sam Altman's OpenAI
As an affiliate, we earn on qualifying purchases.
As an affiliate, we earn on qualifying purchases.
Implications of the Bubble Disentanglement for Stakeholders
Understanding which AI investments are bubble-driven versus genuinely valuable is crucial for investors, founders, policymakers, and users. It influences capital allocation, regulatory focus, and strategic planning, helping avoid misallocation of resources during a potentially volatile cycle while supporting sustainable innovation.Historical and Current Factors Shaping the AI Investment Landscape
The 1999 dotcom bubble was characterized by excessive VC funding, soaring valuations disconnected from fundamentals, and a surge of IPOs at inflated prices. When the bubble burst, many companies collapsed, but some, like Amazon and Cisco, survived and thrived.
Fast forward to 2026, the AI cycle exhibits some similar traits—extreme valuation multiples, concentrated VC investments, and large infrastructure capex. However, unlike 1999, there is observable revenue, real earnings, and productivity improvements, suggesting a different underlying economic dynamic. Experts argue the current cycle is more structurally grounded, though certain segments remain speculative.
“The cycle is structurally bifurcated: some categories resemble a bubble, others show genuine value. Disentangling them is essential for strategic decision-making.”
— Thorsten Meyer
Unresolved Questions About AI Bubble Dynamics
It remains unclear how much of the current valuation reflects speculative hype versus sustainable economic value. The durability of AI-driven productivity gains and the timeline for realizing widespread economic benefits are still debated. Additionally, the extent to which infrastructure investments will translate into long-term competitive advantages is uncertain.
Future Developments and Critical Milestones Through 2027
Monitoring the next 12-24 months will be crucial. Key developments include the progress of AI infrastructure deployment, the realization of productivity gains in enterprise settings, and the response of financial markets to valuation corrections. Regulatory actions and technological breakthroughs could also significantly influence the cycle’s trajectory.
Key Questions
How can investors distinguish bubble-driven investments from genuine ones?
Investors should analyze fundamentals such as revenue growth, earnings, infrastructure deployment, and market concentration, comparing them to valuation multiples and capital allocation patterns.
Are current AI valuations sustainable in the long term?
Some valuations appear inflated, especially in private markets and mega-deals, but certain segments demonstrating revenue and productivity gains may sustain higher valuations.
What risks do infrastructure investments pose to the AI cycle?
Large capex commitments, like the $725 billion in 2026, could lead to impairments if demand or technological progress falls short, especially if driven by bubble-like speculation.
Will the AI bubble burst like the dotcom crash?
While some segments may experience correction, the presence of real revenue, earnings, and productivity improvements suggests a complete crash is less likely than in 1999. The cycle may bifurcate into bubble and durable categories.
Source: ThorstenMeyerAI.com