
📊 Full opportunity report: Unleashing AI To Improve Live Warzone Engagements on ThorstenMeyerAI.com — validation score, market gap, and execution plan.
TL;DR
An innovative AI-based web visualization turns Bitcoin trades into a cinematic war scene, providing an immersive, real-time view of market dynamics. It leverages browser tech and is accessible for free. The project aims to offer artistic insight into market chaos, not trading advice.
A new AI-driven web visualization has launched, transforming live Bitcoin trading activity into a cinematic battlefield. Developed by isbitcoindead.com, this tool offers an immersive, real-time visual experience of market dynamics, accessible through any modern browser. The project aims to provide an artistic interpretation of market chaos, not trading advice or tools.
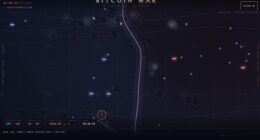
The visualization, called Bitcoin War, connects directly to Binance’s public WebSocket trade stream, with a fallback to Coinbase, ensuring continuous data flow. It depicts each trade as a combatant in a war scene, with buy orders from the Cobalt Host advancing from the left and sell orders from the Ember Legion countering from the right. Large liquidations are visualized as airstrikes, adding visceral impact. The entire system runs client-side using Canvas 2D graphics, WebAudio synthesis, and real-time processing, with a minimal footprint of approximately 180KB.
An automatic camera system shifts perspectives to highlight different aspects of the market conflict, while a live DEFCON meter indicates volatility levels. A scrolling war log narrates ongoing activity, and a synthetic soundtrack amplifies the tension. A comprehensive scoreboard tracks seconds won, casualties, and dollar gains, creating a dynamic visual narrative. Importantly, the project explicitly states that it is not a trading tool, wallet, or signal provider, emphasizing its artistic and data visualization purpose.
Implications of Visualizing Market Chaos as Warfare
This project demonstrates how advanced web technologies can be harnessed for creative data visualization, offering a new way to interpret and engage with financial markets. It provides an accessible, immersive experience that highlights the volatility and chaos inherent in cryptocurrency trading, potentially appealing to both enthusiasts and artists. While it does not offer trading advice, it underscores the power of browser-based tech to turn complex data into visceral, cinematic narratives, broadening the scope of data visualization beyond traditional charts.
web-based data visualization tools
As an affiliate, we earn on qualifying purchases.
As an affiliate, we earn on qualifying purchases.
Background of Market Visualization Innovations
Recent years have seen increasing interest in visual representations of financial data, with some projects exploring artistic and immersive formats. The Bitcoin War visualization builds on this trend by integrating real-time market data with browser-native graphics and sound, creating a visceral experience. Unlike conventional charts, it emphasizes the chaos and conflict of trading, aligning with broader efforts to make data more engaging and accessible. The project is part of a growing movement to explore creative applications of web technologies in financial and data visualization domains.
“This visualization offers a new perspective on market dynamics, turning data into an immersive battlefield that captures the chaos of trading.”
— an anonymous researcher
cryptocurrency market visualization
As an affiliate, we earn on qualifying purchases.
As an affiliate, we earn on qualifying purchases.
Unclear Aspects of the Visualization’s Impact
It is not yet clear how this visualization influences viewer understanding or engagement with actual market data. Its artistic focus suggests it is primarily for entertainment and artistic expression, but its potential educational or analytical value remains untested. Additionally, the long-term sustainability and potential for broader adoption are still unknown, as the project is currently a proof of concept and not integrated into trading platforms.
interactive market data display
As an affiliate, we earn on qualifying purchases.
As an affiliate, we earn on qualifying purchases.
Future Developments and Potential Applications
Further development could see the integration of more detailed market data or interactive features, potentially expanding its use beyond artistic visualization. Developers might explore educational applications or even experimental tools for traders to visualize market sentiment visually. Monitoring user feedback and engagement metrics will inform whether similar visualizations could influence market perception or trading behavior in the future. The project’s creators may also consider open-sourcing the technology for wider experimentation.
Bitcoin trading visualization
As an affiliate, we earn on qualifying purchases.
As an affiliate, we earn on qualifying purchases.
Key Questions
Is this visualization meant for trading decisions?
No, the project explicitly states that it is not a trading tool, wallet, or signal provider. It is designed solely as an artistic and data visualization experience.
How does the visualization work technically?
It connects directly to Binance’s public WebSocket trade stream, visualizing each trade as a combatant in a cinematic war scene using browser-based Canvas 2D graphics and WebAudio synthesis, with no backend infrastructure.
Can I access this visualization for free?
Yes, it is available for free and can be run instantly in any modern browser by visiting war.isbitcoindead.com.
What makes this visualization different from traditional market charts?
Instead of static or line charts, it offers a real-time, cinematic depiction of market activity as a battlefield, emphasizing chaos and conflict rather than precise data analysis.
Source: ThorstenMeyerAI.com